LnRiLWZpZWxke21hcmdpbi1ib3R0b206MC43NmVtfS50Yi1maWVsZC0tbGVmdHt0ZXh0LWFsaWduOmxlZnR9LnRiLWZpZWxkLS1jZW50ZXJ7dGV4dC1hbGlnbjpjZW50ZXJ9LnRiLWZpZWxkLS1yaWdodHt0ZXh0LWFsaWduOnJpZ2h0fS50Yi1maWVsZF9fc2t5cGVfcHJldmlld3twYWRkaW5nOjEwcHggMjBweDtib3JkZXItcmFkaXVzOjNweDtjb2xvcjojZmZmO2JhY2tncm91bmQ6IzAwYWZlZTtkaXNwbGF5OmlubGluZS1ibG9ja311bC5nbGlkZV9fc2xpZGVze21hcmdpbjowfQ==
IEBtZWRpYSBvbmx5IHNjcmVlbiBhbmQgKG1heC13aWR0aDogNzgxcHgpIHsgICB9IEBtZWRpYSBvbmx5IHNjcmVlbiBhbmQgKG1heC13aWR0aDogNTk5cHgpIHsgICB9IA==
Program History
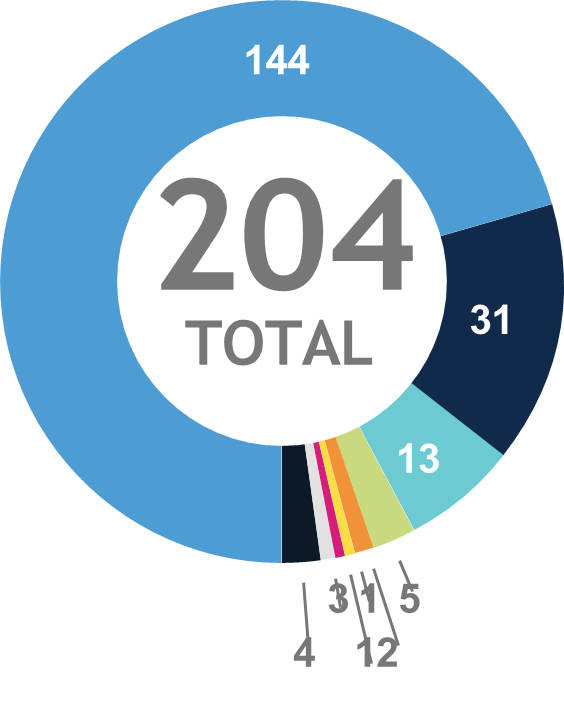
Race & Ethnicity
- African American: 144
- Hispanic/Latino: 31
- American Indian: 13
- Asian American: 5
- Asian: 2
- Indian American: 1
- Pacific Islander: 1
- Two or More: 3
- Not Reported: 4
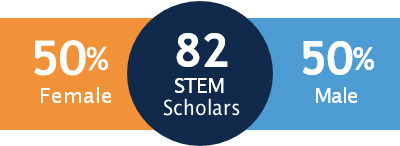
Gender
Impact in STEM Fields
Alumni Career Outcomes
| 76 | UNC Faculty
Hires |
| 47 | Colleges and
Universities |
| 35 | Full Professors &
Distinguished Professorships |
| 2 | University
Presidents |