
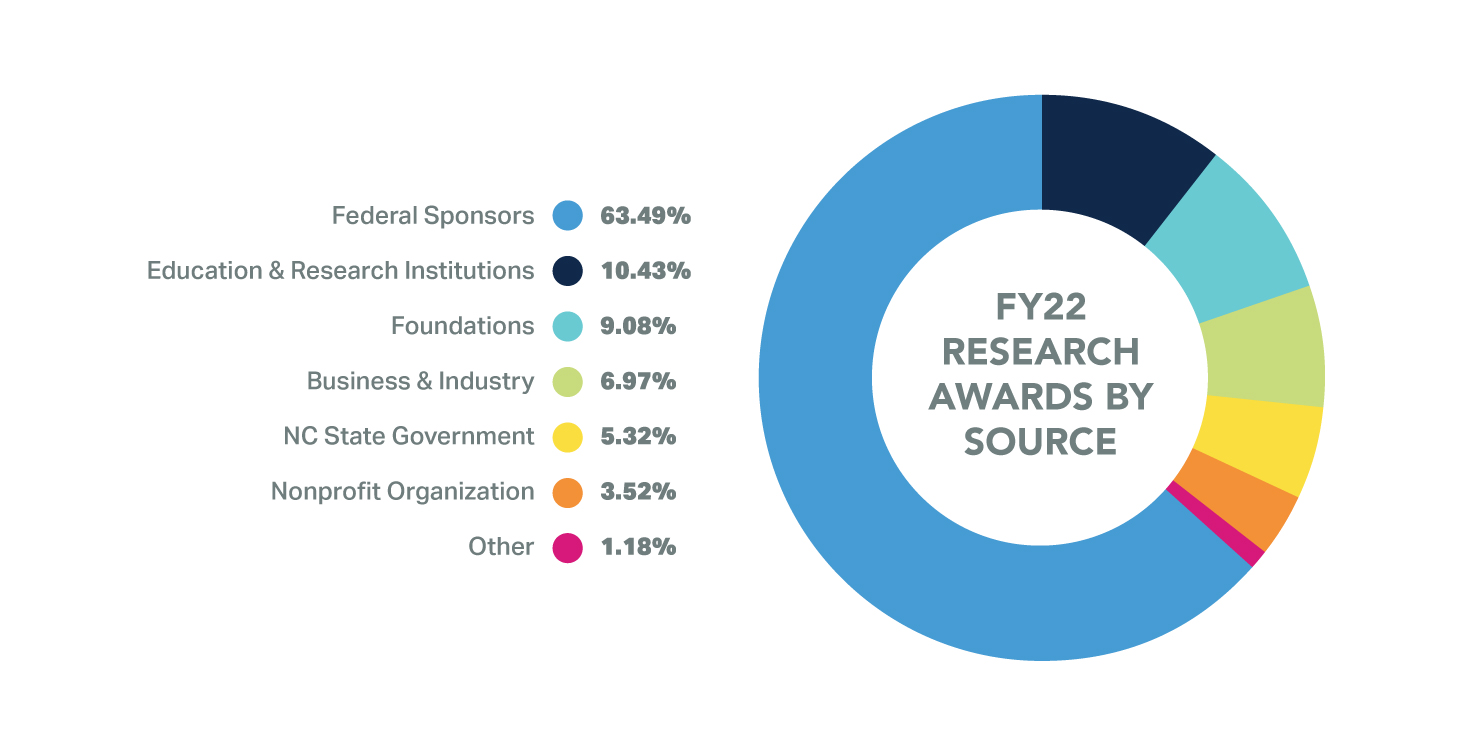
Research Funding
*American Recovery and Reinvestment Act of 2009
| 1998: $304,953,768 | 1999: $344,496,859 | 2000: $375,570,798 |
| 2001: $438,780,503 | 2002: $487,906,010 | 2003: $537,415,870 |
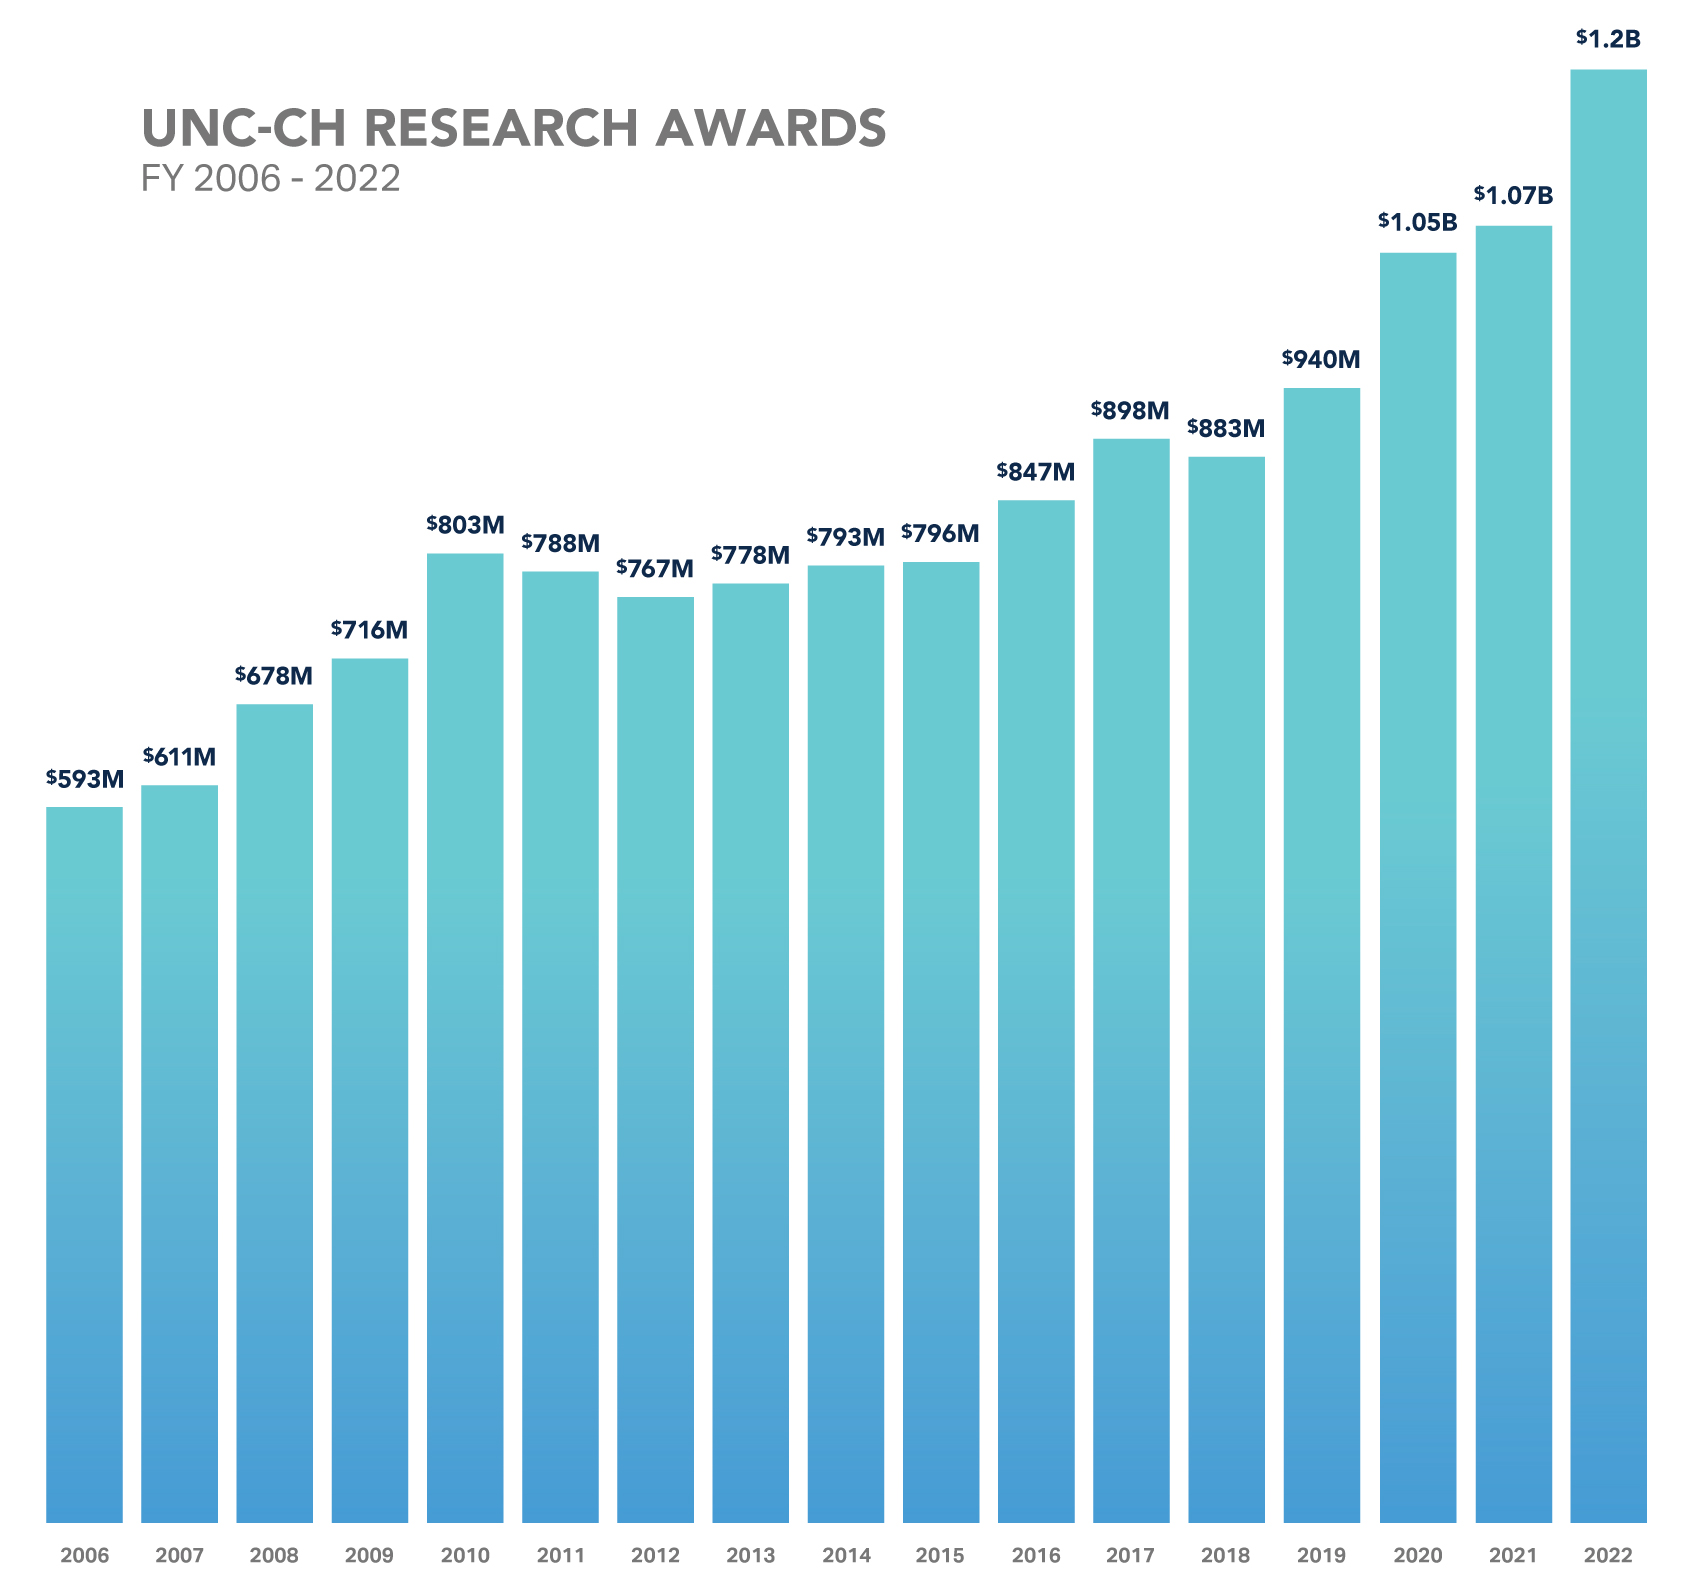
| 2004: $577,577,064 | 2005: $579,589,394 | 2006: $593,390,527 |
| 2007: $610,669,824 | 2008: $678,228,055 | 2009: $716,274,113 (includes $4,501,984 in ARRA* funding) |
| 2010: $803,358,125 (includes $126,036,558 in ARRA* funding) |
2011: $788,025,111 (includes $55,554,596 in ARRA* funding) |
2012: $767,141,341 (includes $7,460,219 in ARRA* funding) |
| 2013: $777,838,266 (includes $5,006,018 in ARRA* funding) |
2014: $792,729,006 (includes $3,546,541 in ARRA* funding) |
2015: $796,171,469 |
| 2016: $846,680,025 | 2017: $897,546,237 | 2018: $882,967,375 |
| 2019: $941,163,945 | 2020: $1,048,785,827 | 2021: $1,073,632,927 |
| 2022: $1,203,070,371 |
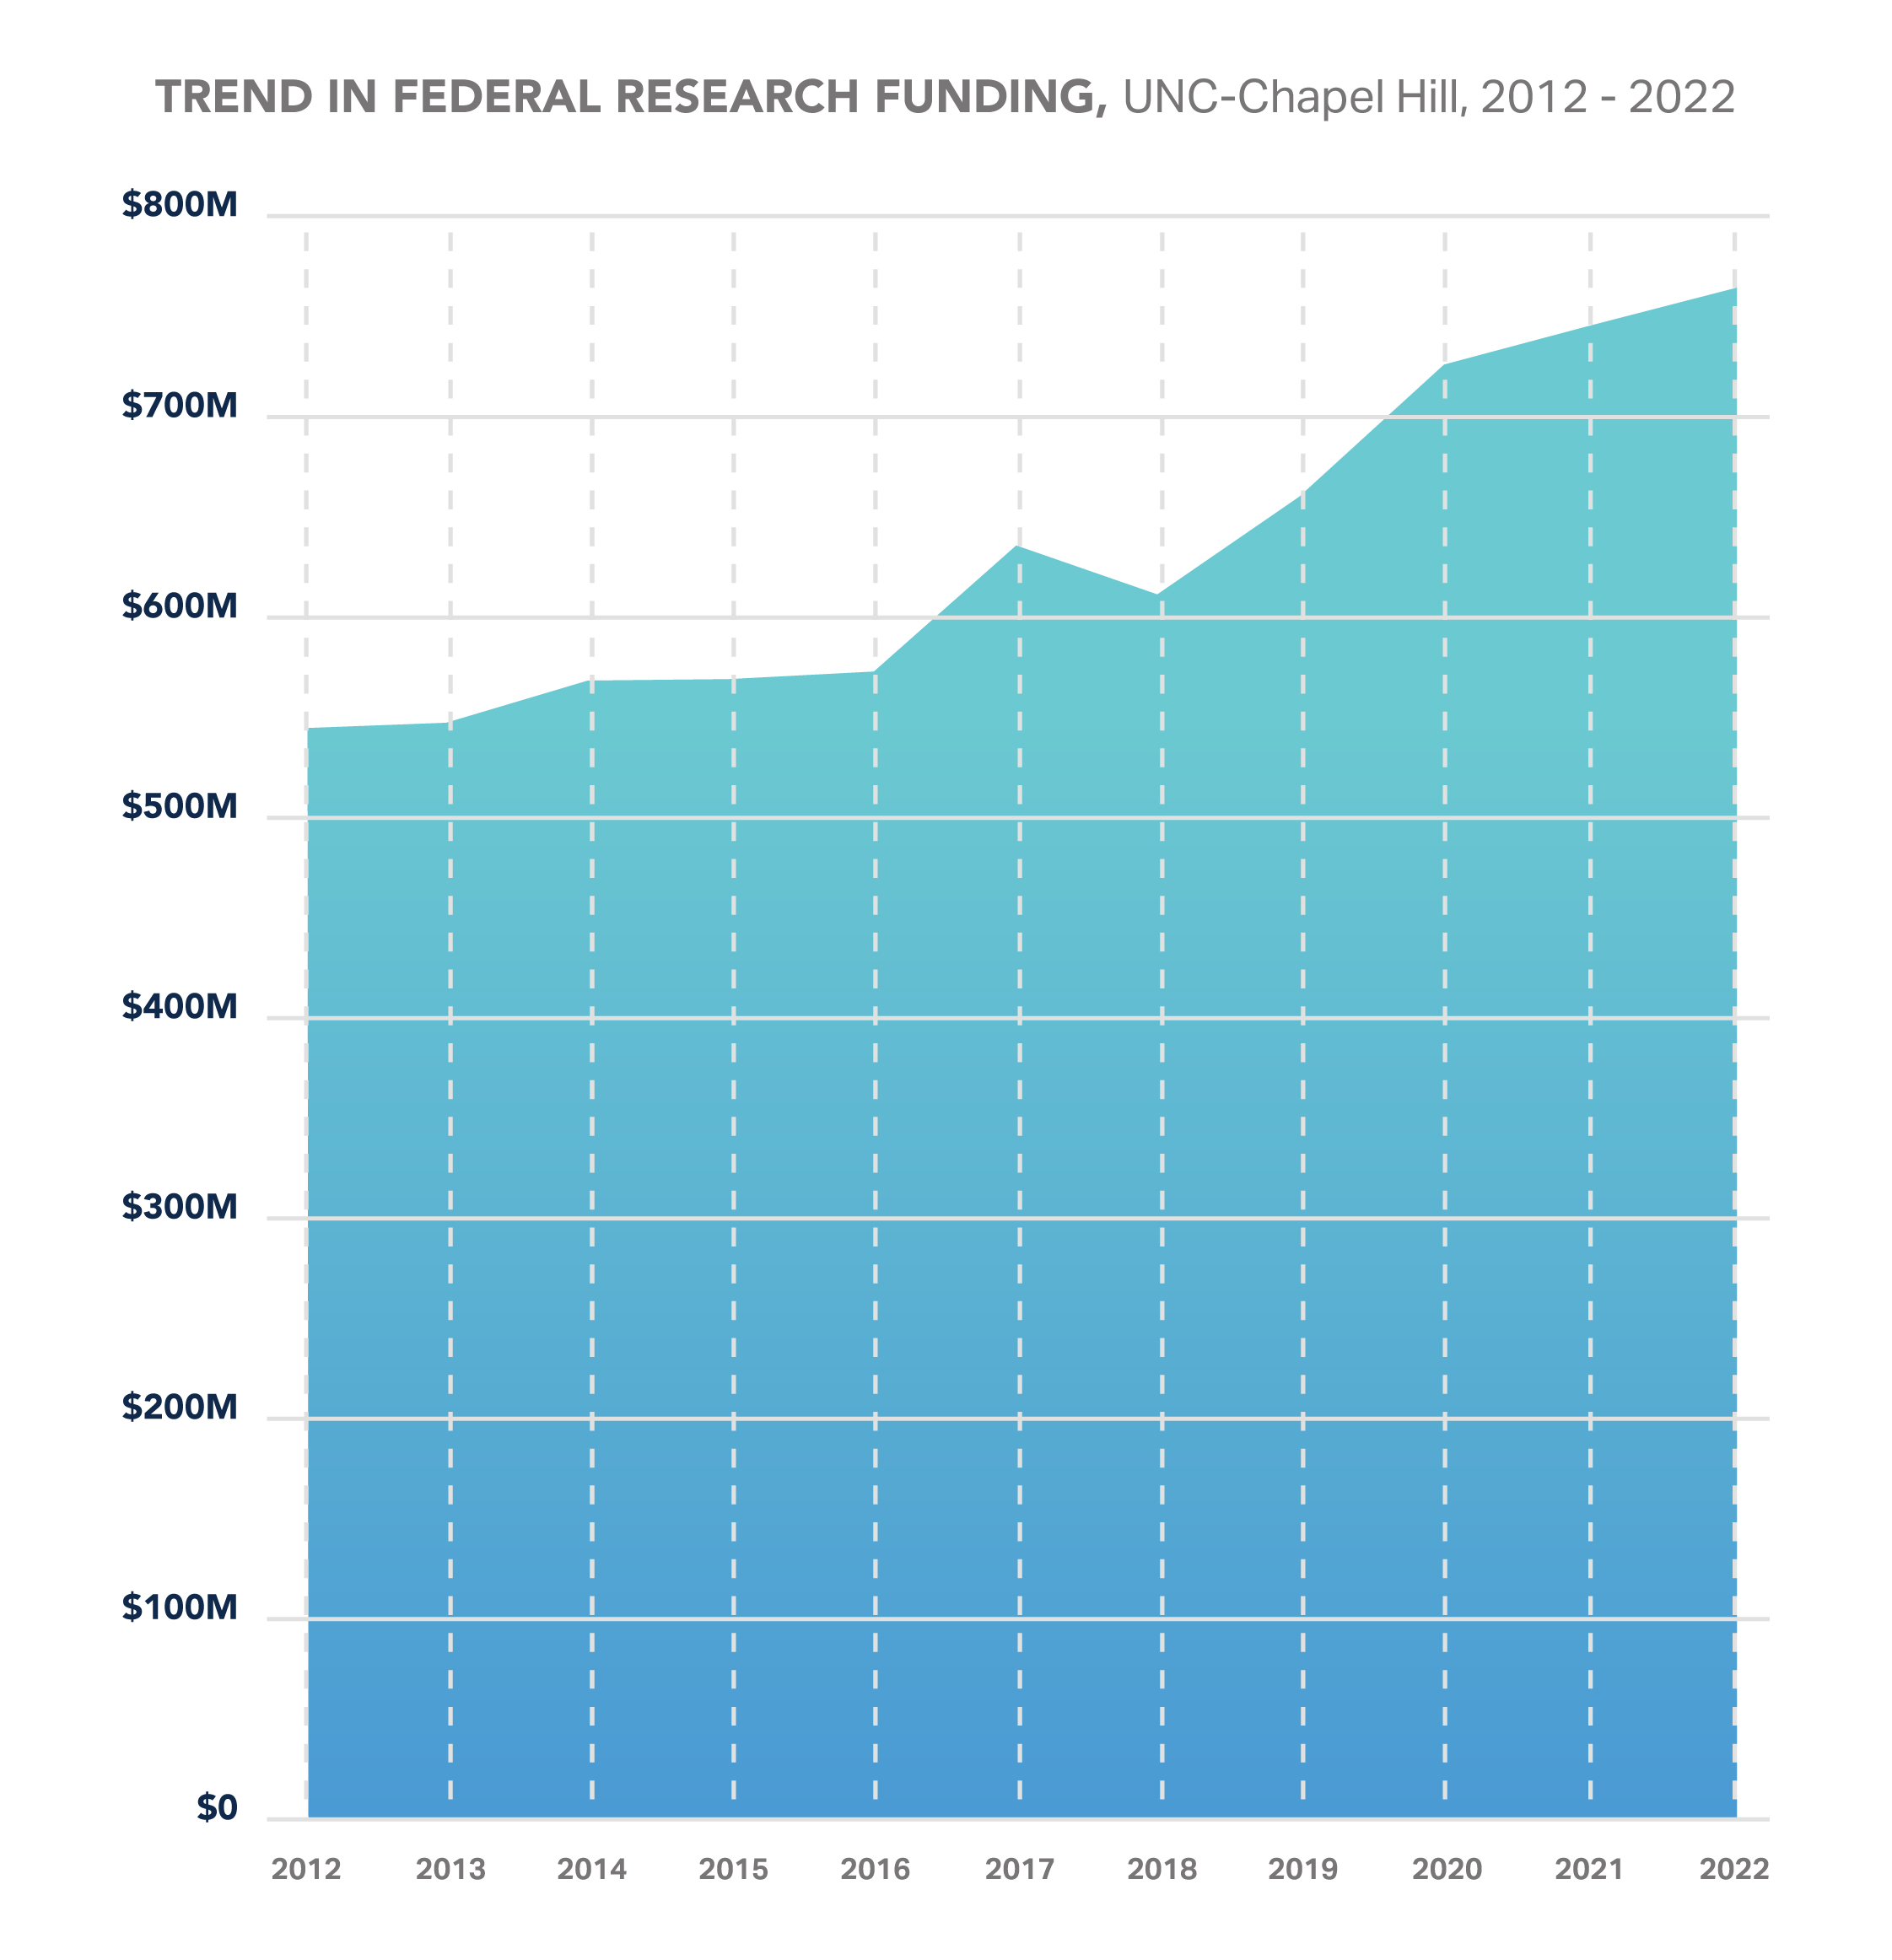
Trend in Federal Research Funding, UNC-Chapel Hill, 2011-2021
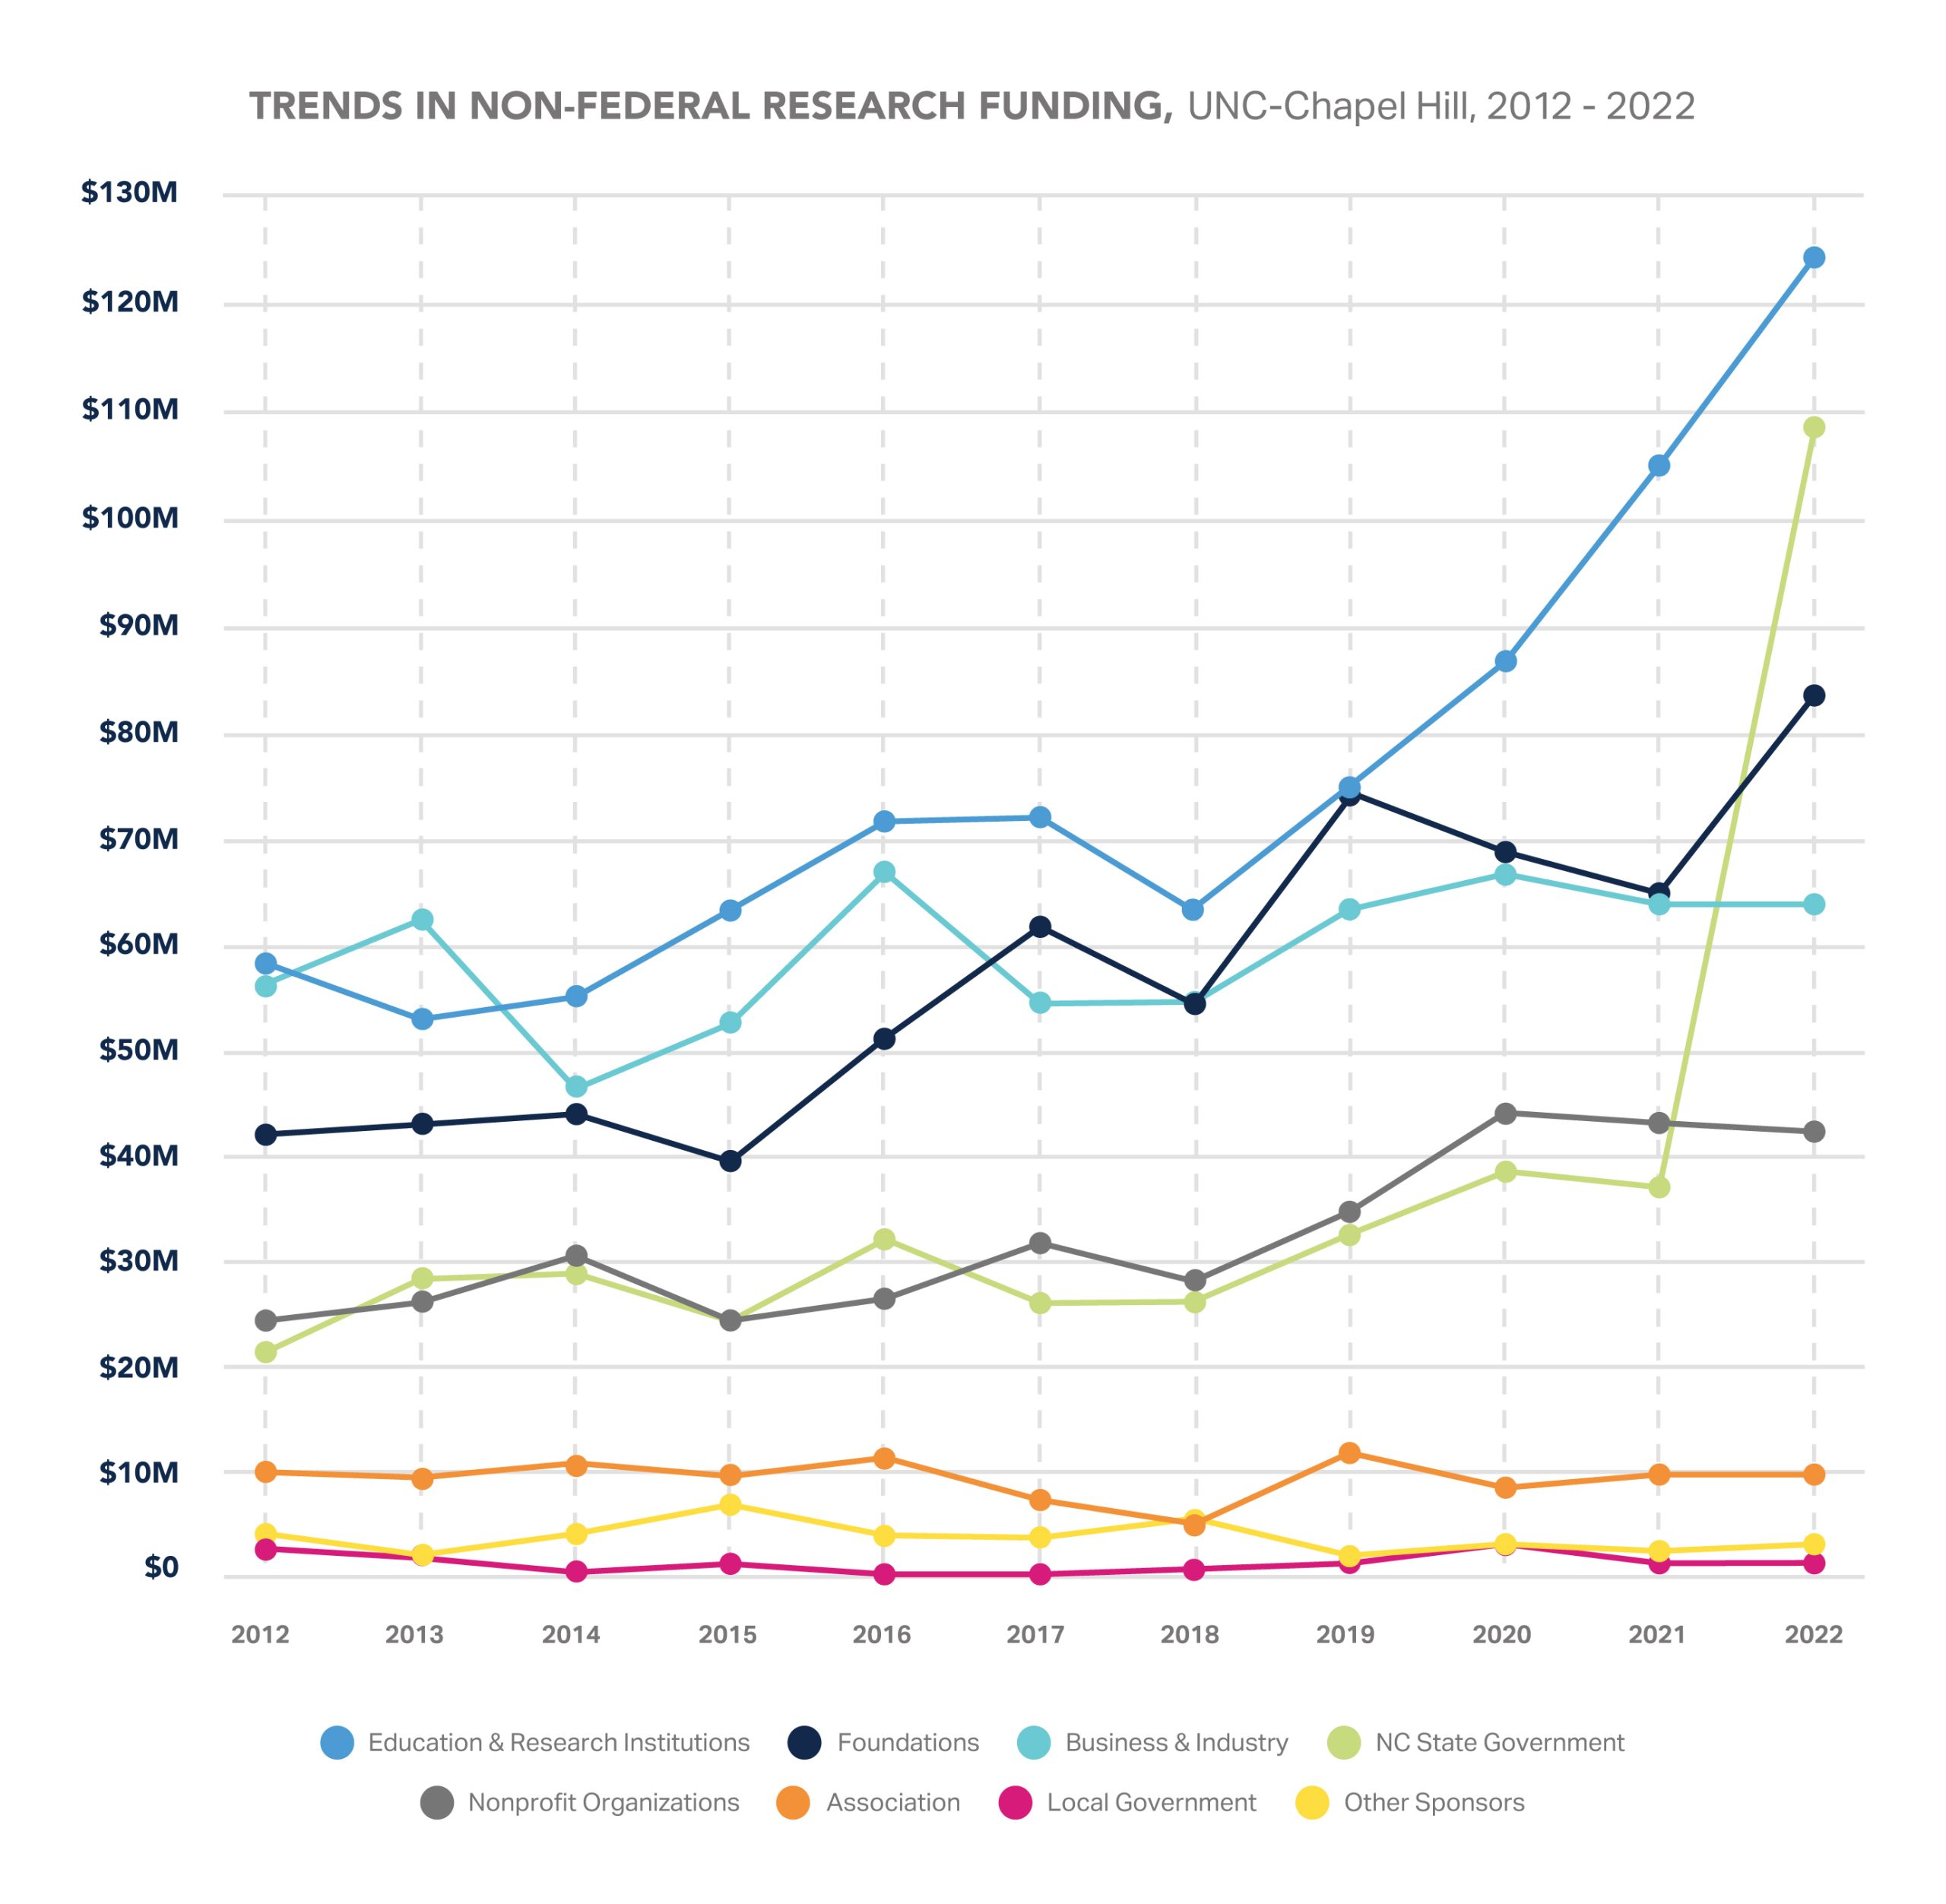
Trends in Non-federal Research Funding, UNC-Chapel Hill, 2011-2021
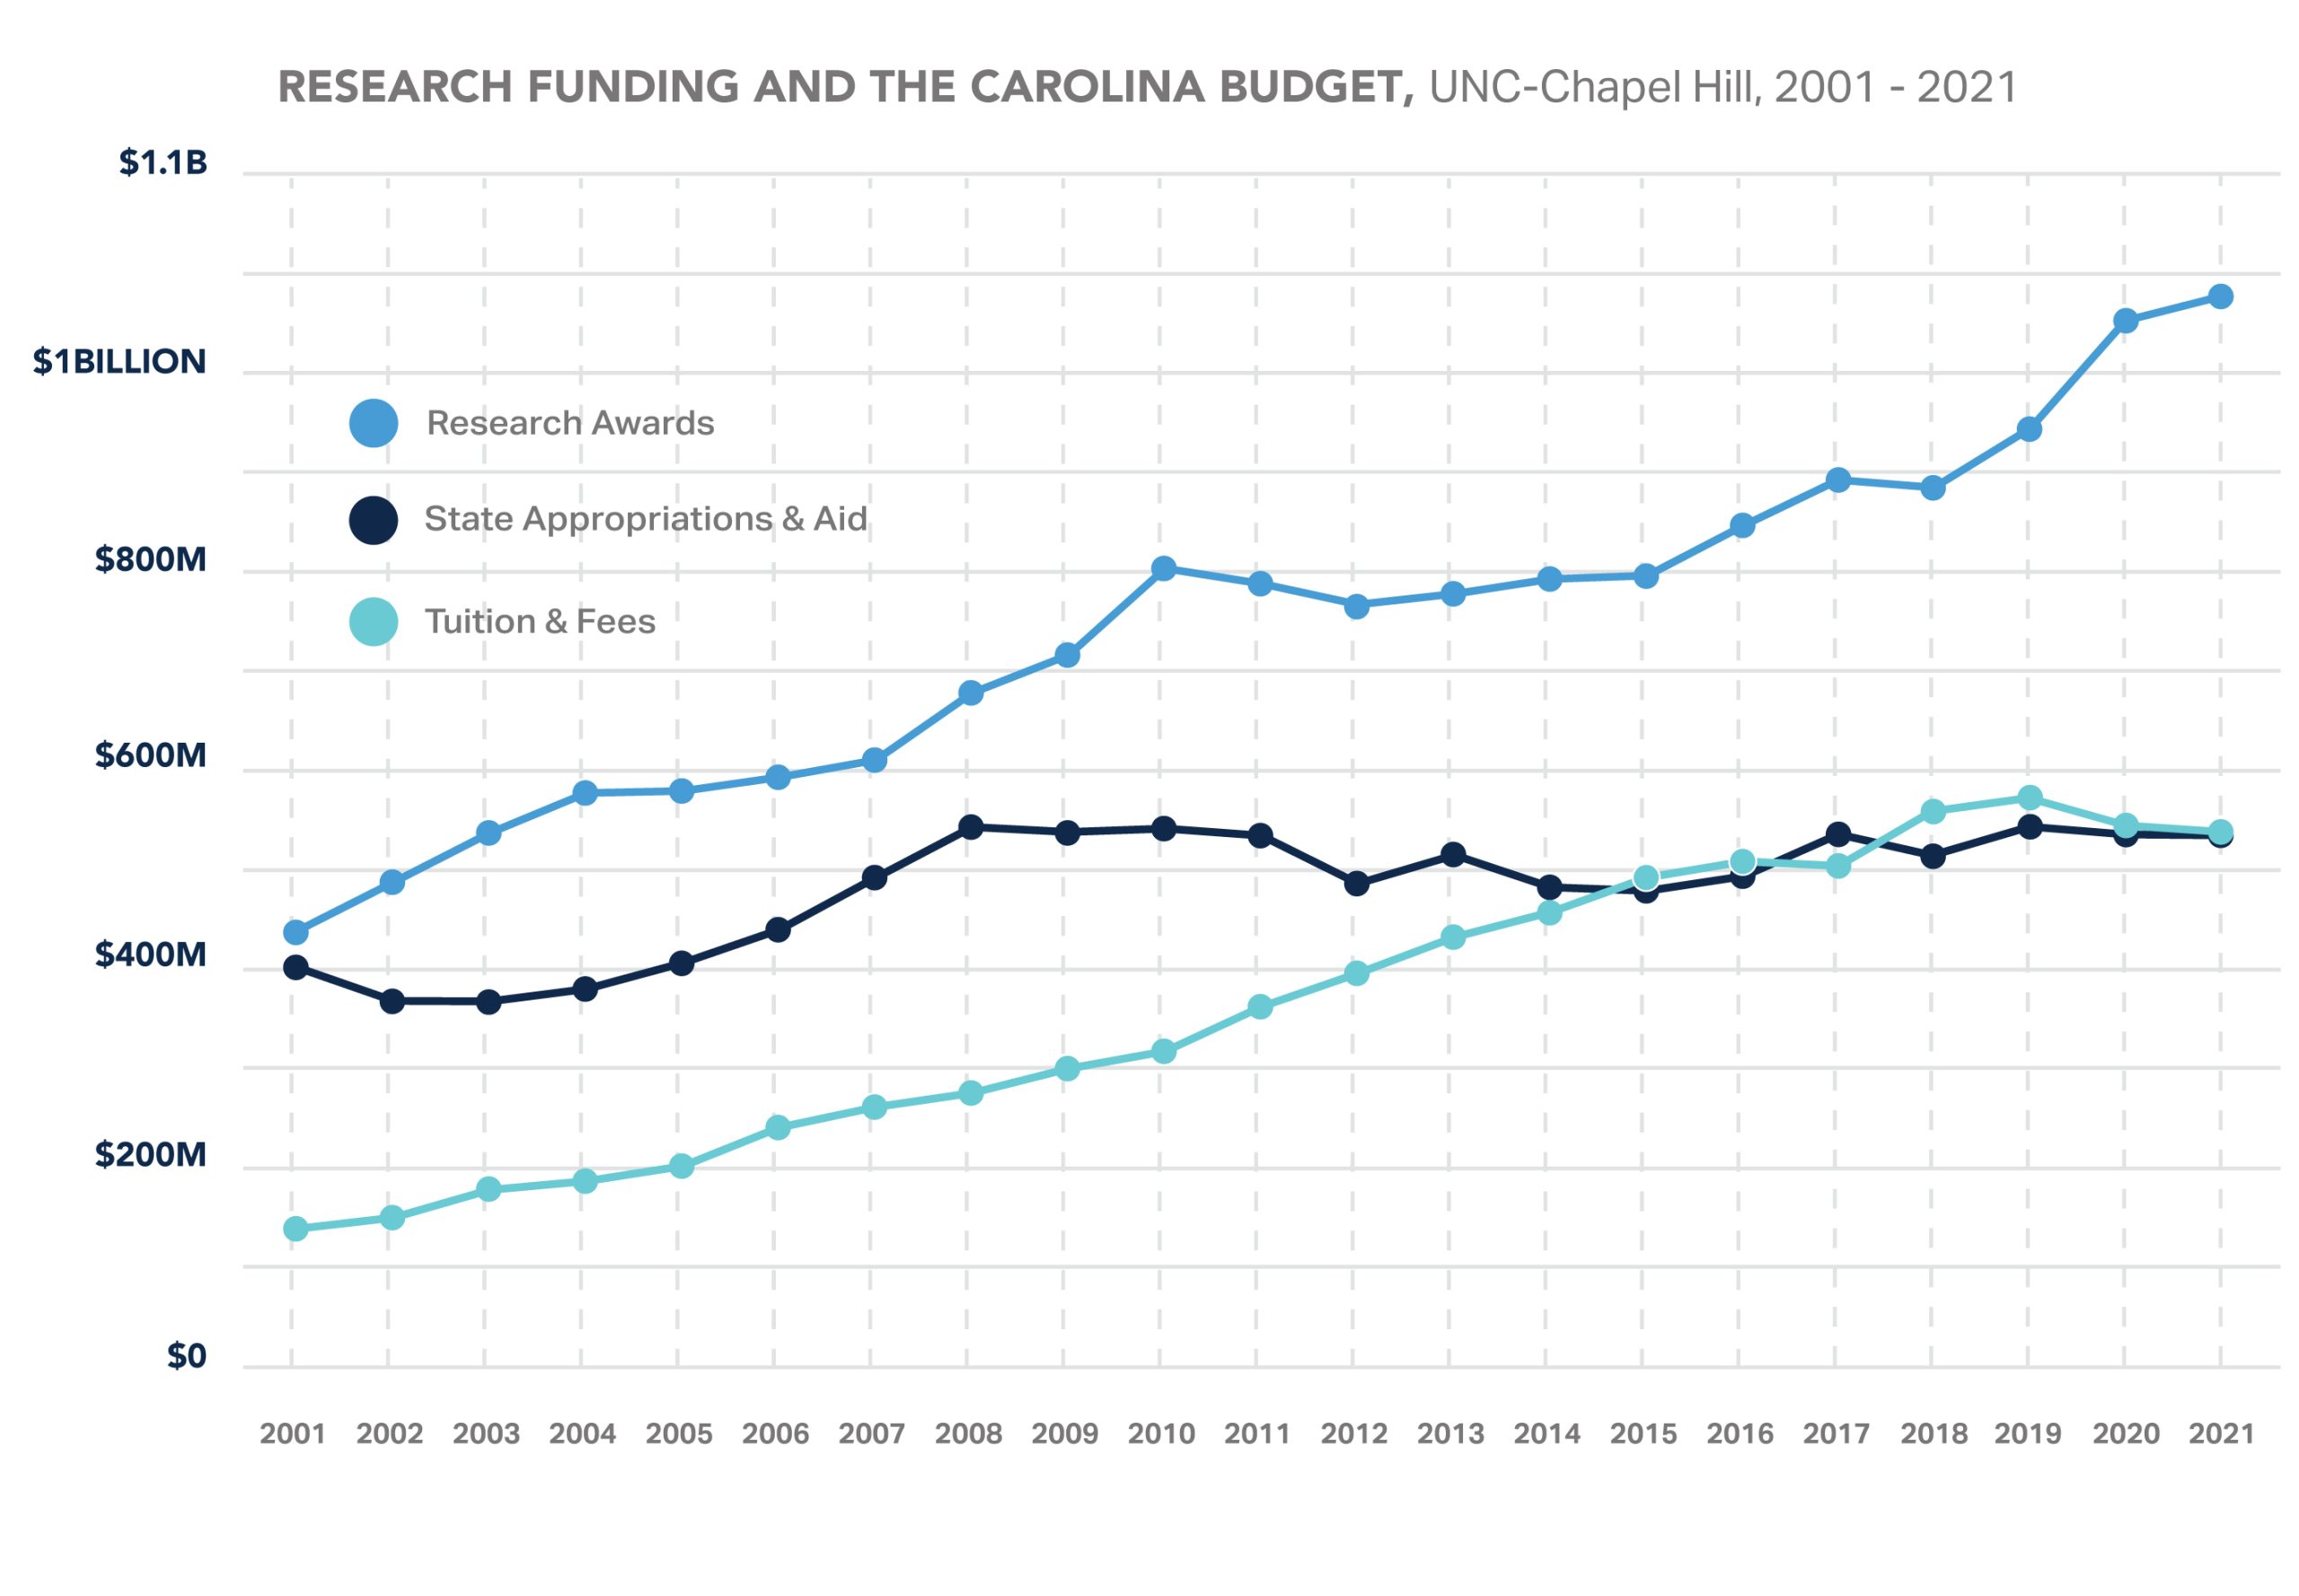
Research Funding and the UNC-Chapel Hill Budget
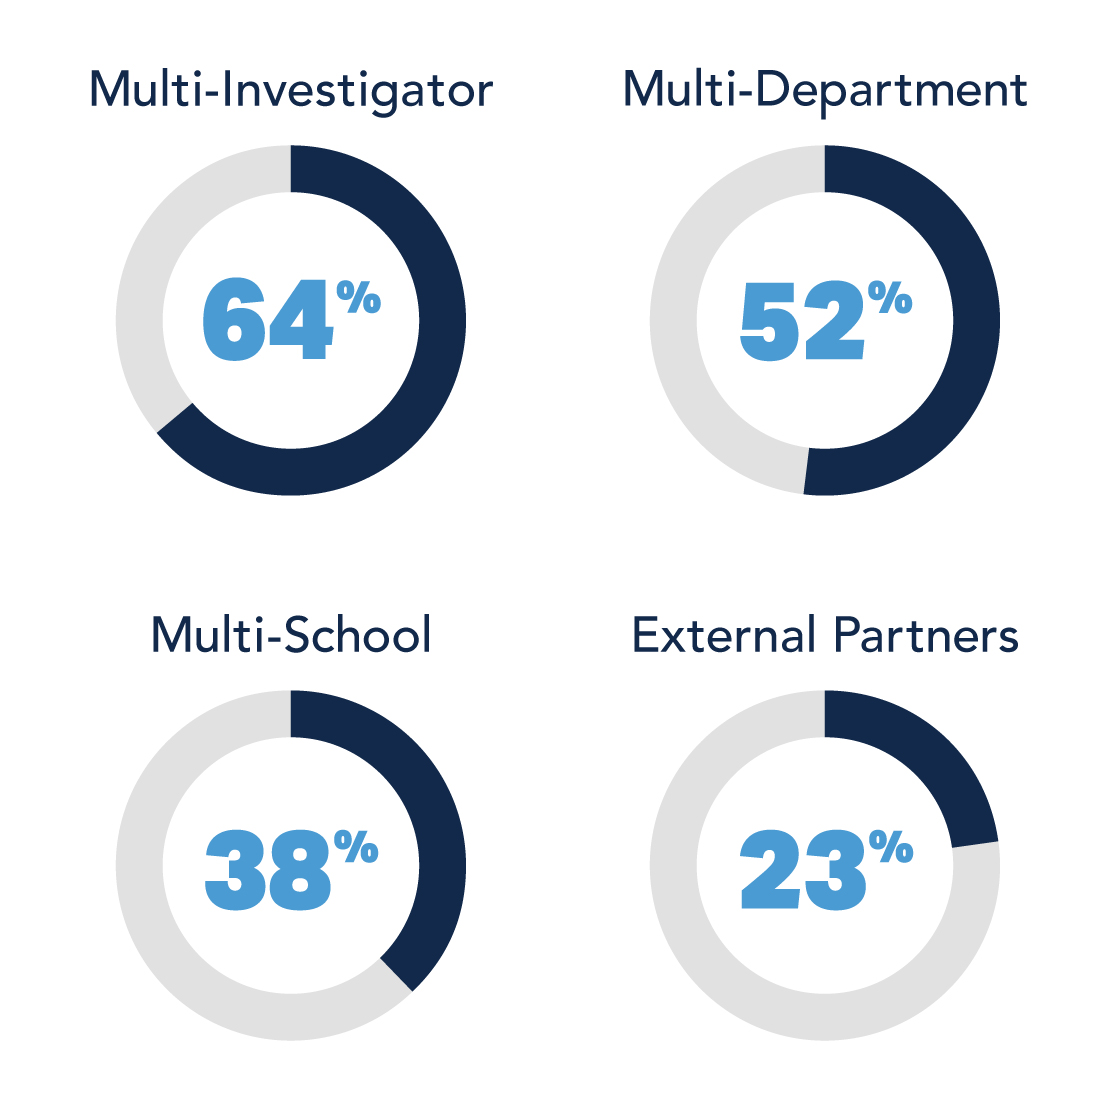
Collaborative Research Funding, 2021
Research is a team effort, with UNC faculty members collaborating across disciplines, departments, and schools, and partnering with scientists at other institutions in North Carolina and worldwide.
Research Funding by Administrative Unit and by Appointing Department
Research and Development Expenditures at Universities and Colleges
Based on the most recent overview from the NSF, UNC-Chapel Hill ranked:
- Sixth in federal R&D expenditures for the level of federal funding ($721 million) devoted to research and development in all fields during fiscal 2019. (Source: National Science Foundation. Updated: 2/2021.)
- Twelfth in total R&D expenditures during fiscal year 2019 ($1.15 billion) (Source: NSF. Updated: 2/2021.)
Highlights in Overall Rankings in Federal Funding
Based on most recently available federal award data from the National Science Foundation, the University of North Carolina at Chapel Hill ranks:
- Ninth in federal obligations for academic science and engineering R&D for FY 2019 ($702 million)
- Sixth nationally and first in the South in federally funded research and development expenditures at public and private universities and colleges in FY 2019 ($721 million)
- Tenth in federal obligations for science and engineering fellowships, traineeships and training grants in FY 2018 ($25 million)
(Source: NSF. Updated: 2/2021.)
National Institutes of Health Awards to Institutions of Higher Education
For FY 2019, the University of North Carolina at Chapel Hill was ranked eighth among both private and public universities nationwide for DHHS and National Institutes of Health (NIH) research funding to domestic institutions of higher education. UNC-Chapel Hill faculty researchers receive more than $522 million in NIH research funding annually.
(Source: NSF. Updated: 2/2021.)
Federal Obligations for Science and Engineering Research and Development
Based on the most recently available data (FY 2018) from the National Science Foundation, UNC-Chapel Hill ranks:
- Fourteenth in federal obligations for science and engineering ($517 million)
- Fifteenth in federal obligations for science and engineering R&D ($476 million)
- Tenth in federal obligations for fellowships, traineeships, and training grants ($25 million)
(Source: NSF. Updated: 5/2020.)
Information concerning the nature and use of F&A funds at UNC-Chapel Hill can be found on PDFs below: